The Texas Flood Catastrophe: A Forensic Breakdown of the Deadliest Flash Flood in 49 Years
Explore how FEMA's missteps, broken infrastructure, and rising climate extremes collided during Texas' deadly floods. This deep-dive exposes overlooked timelines, damage visuals, and policy gaps that turned a disaster into a preventable catastrophe.

–Written by Lavanya, Intern, Allegedly The News
CENTRAL TEXAS, USA, July 23, 2025
In the early hours of July 4, 2025, Central Texas, particularly around the Guadalupe River basin, faced one of the worst natural disasters in recent memory. More than 20 inches of rain fell in less than 48 hours, with over 6 inches in the first three hours of the flood. This caused a flash flood wave that soared to 26 feet, claiming over 135 lives, destroying entire communities, and severely impacting rural camps like Camp Mystic. Many people drowned in the swift water. Highways became dangerous traps, bridges collapsed mid-flow, and warning systems either failed completely or activated too late.
This investigation uncovers the meteorological factors, climate science, infrastructure weaknesses, government missteps, and human experiences that were both tragic and heroic. It explains why this flood occurred and why, despite decades of warnings, it resulted in so much loss, making it the deadliest flash flood incident in 49 years.
Forensic Timeline of Disaster
July 1–2, 2025: Rainfall Buildup & Atmospheric Instability
A consistent monsoon-like pattern brought 2–3 inches of rain daily across Texas Hill Country, saturating soils and swelling creeks and tributaries. Groundwater levels rose sharply, decreasing the land's capacity to soak up more water.
Forecasters at the NWS indicated that thunderstorms were trapped due to a stalled low-pressure system over West Texas.
July 3, Early Afternoon: Weather Watch Activated
At 1 p.m., the Austin–San Antonio area issued flash flood watches and warned of "significant flooding in vulnerable spots" in Kerr, Bandera, Comal, and Kendall counties. Although these alerts were available to the public, they were not widely broadcast; some local radio stations did not mention them.
The larger issue was that the IPAWS systems had never been tested during high traffic; county officials opted not to activate them until a "crisis threshold" was reached.
July 3, 6–11 p.m.: Atmospheric Moisture Convergence
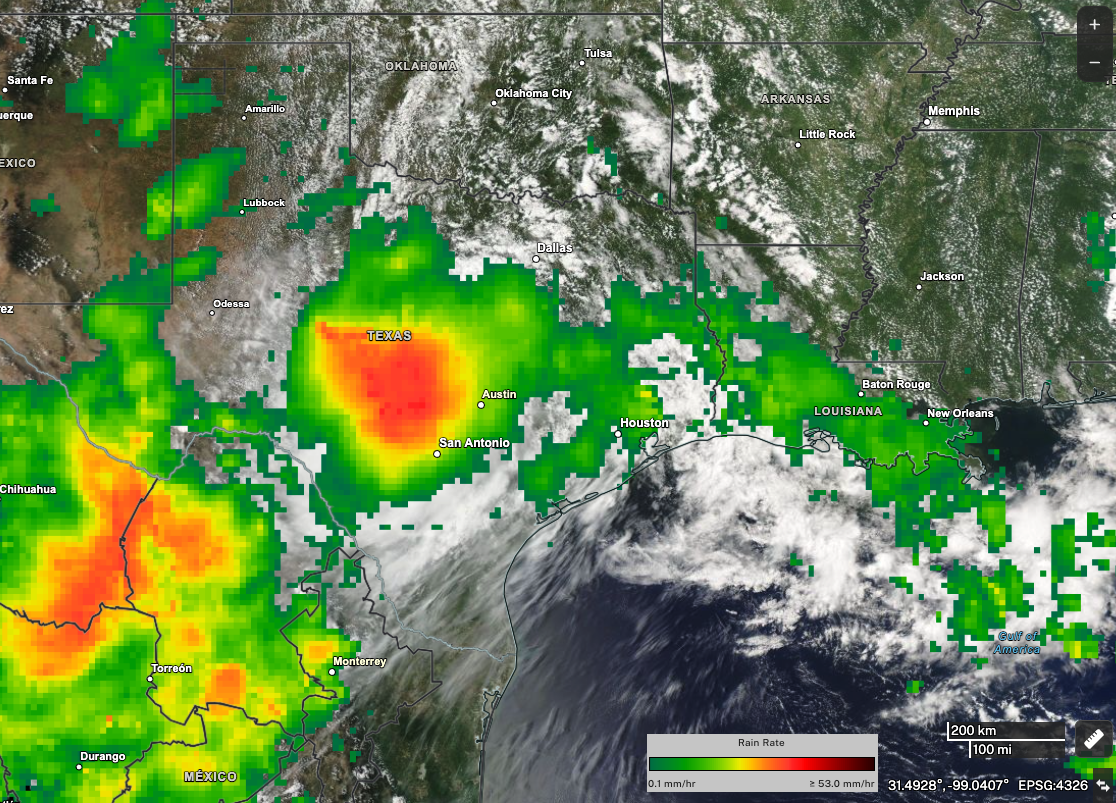
Remnants of Tropical Storm Barry from the Gulf combined with moisture from the Pacific. Satellite imagery showed heat signatures across Kerr County, indicating intense storms. These storms contained deep moisture levels.
The storms stalled directly over steep mesas and canyons, setting the stage for flash flooding.
July 4, 12:00–03:00 a.m.: The Historic Deluge
Rainfall rates surpassed 3 inches per hour for several hours. In Streeter and Hunt, gauges showed over 10 inches of rain overnight.
By 3 a.m., the Guadalupe River was rising at more than 10 feet per hour, overwhelming older stations like Hunt and Ingram, which recorded rises of more than 22 feet in just two hours—unprecedented levels.
July 4, 03:00–05:00 a.m.: Crest and Catastrophe
Forecasts predicted flood crests above 37 feet, far exceeding the 100-year flood stage, creating a wall of roaring water.
Camp Mystic, located along the south fork, lost six cabins in just 10 minutes. Only 10 out of 37 campers survived, while the others perished in watertight cabins now submerged under more than 8 feet of water.
Highways 16, 39, and 337 turned into submerged rivers, with cars stalling mid-current. Drivers who tried to wade through became victims.
July 4, 05:00–08:00 a.m.: Warnings Fail, Rescue Delays
Kerrville PD declared a Level 3 "Flash Flood Emergency" at 05:16 a.m., after the flood peak had already passed.
IPAWS alerts either failed to send or arrived long after the water had crested; local sirens did not activate. Rising water disabled cell towers. Camp Mystic staff considered evacuation at 4 a.m., but held off due to procedural warnings about a "lack of official orders."
Volunteers with drones tried to locate survivors, launching semi-organized rescue efforts with kayaks and ATVs. FEMA personnel faced delays due to road damage and coordination issues.
July 4–6: Ripple Effects and Widening Impact
By July 5, flash flood warnings extended to Lake Travis Basin and Balcones Escarpment areas. Rainfall totals exceeded 20 inches in some upstream areas.
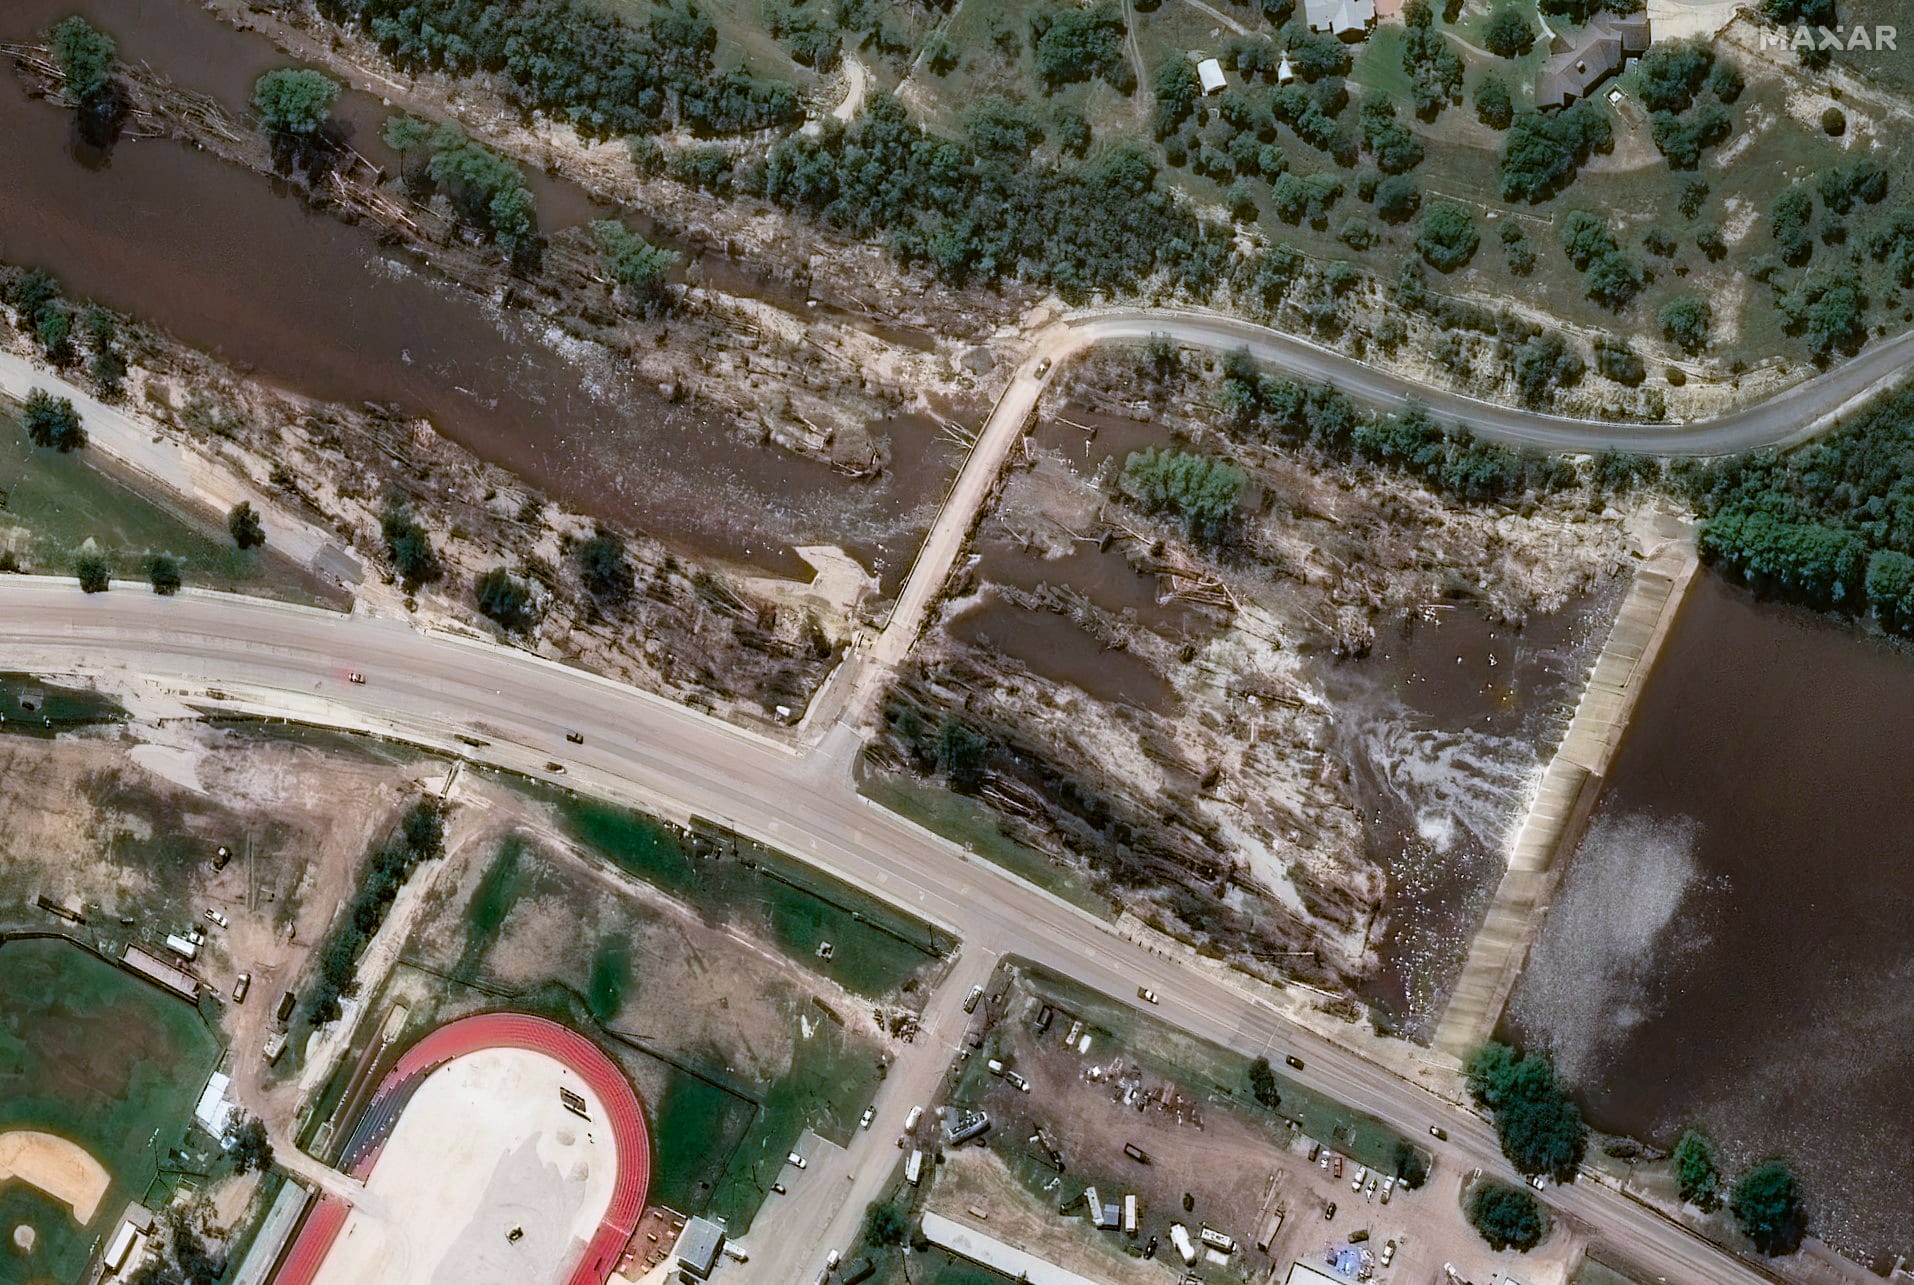
Dozens of bridges, including RN-18, collapsed. Highways 87 and parts of I-10 were cut off.
Over 1,100 people evacuated; more than 400 were rescued during the flood. Reports of 1,200 missing drew national media attention.
July 7–12: Post-Catastrophe Data & Accountability
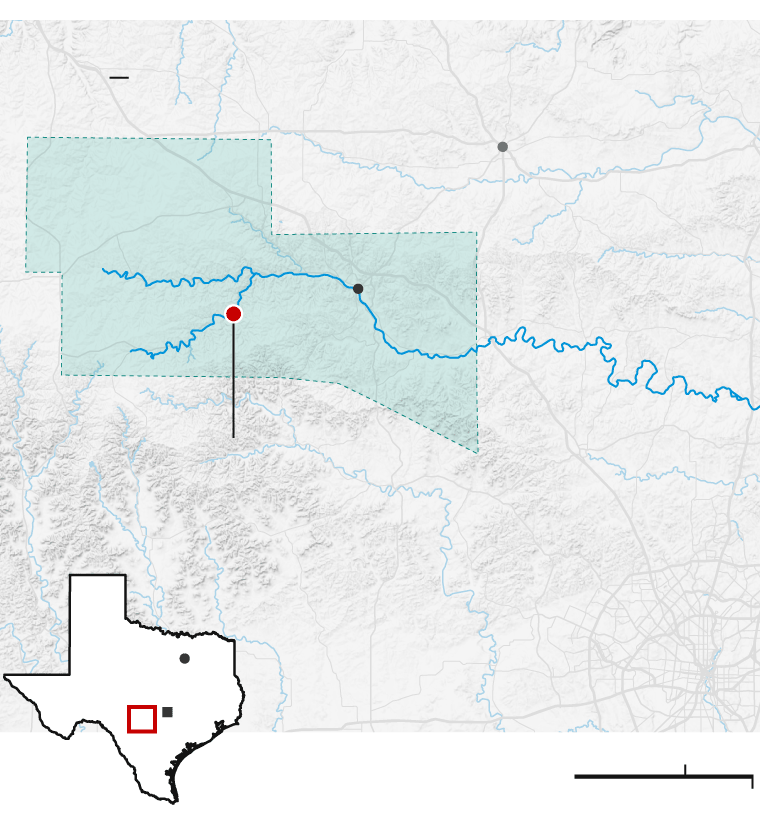
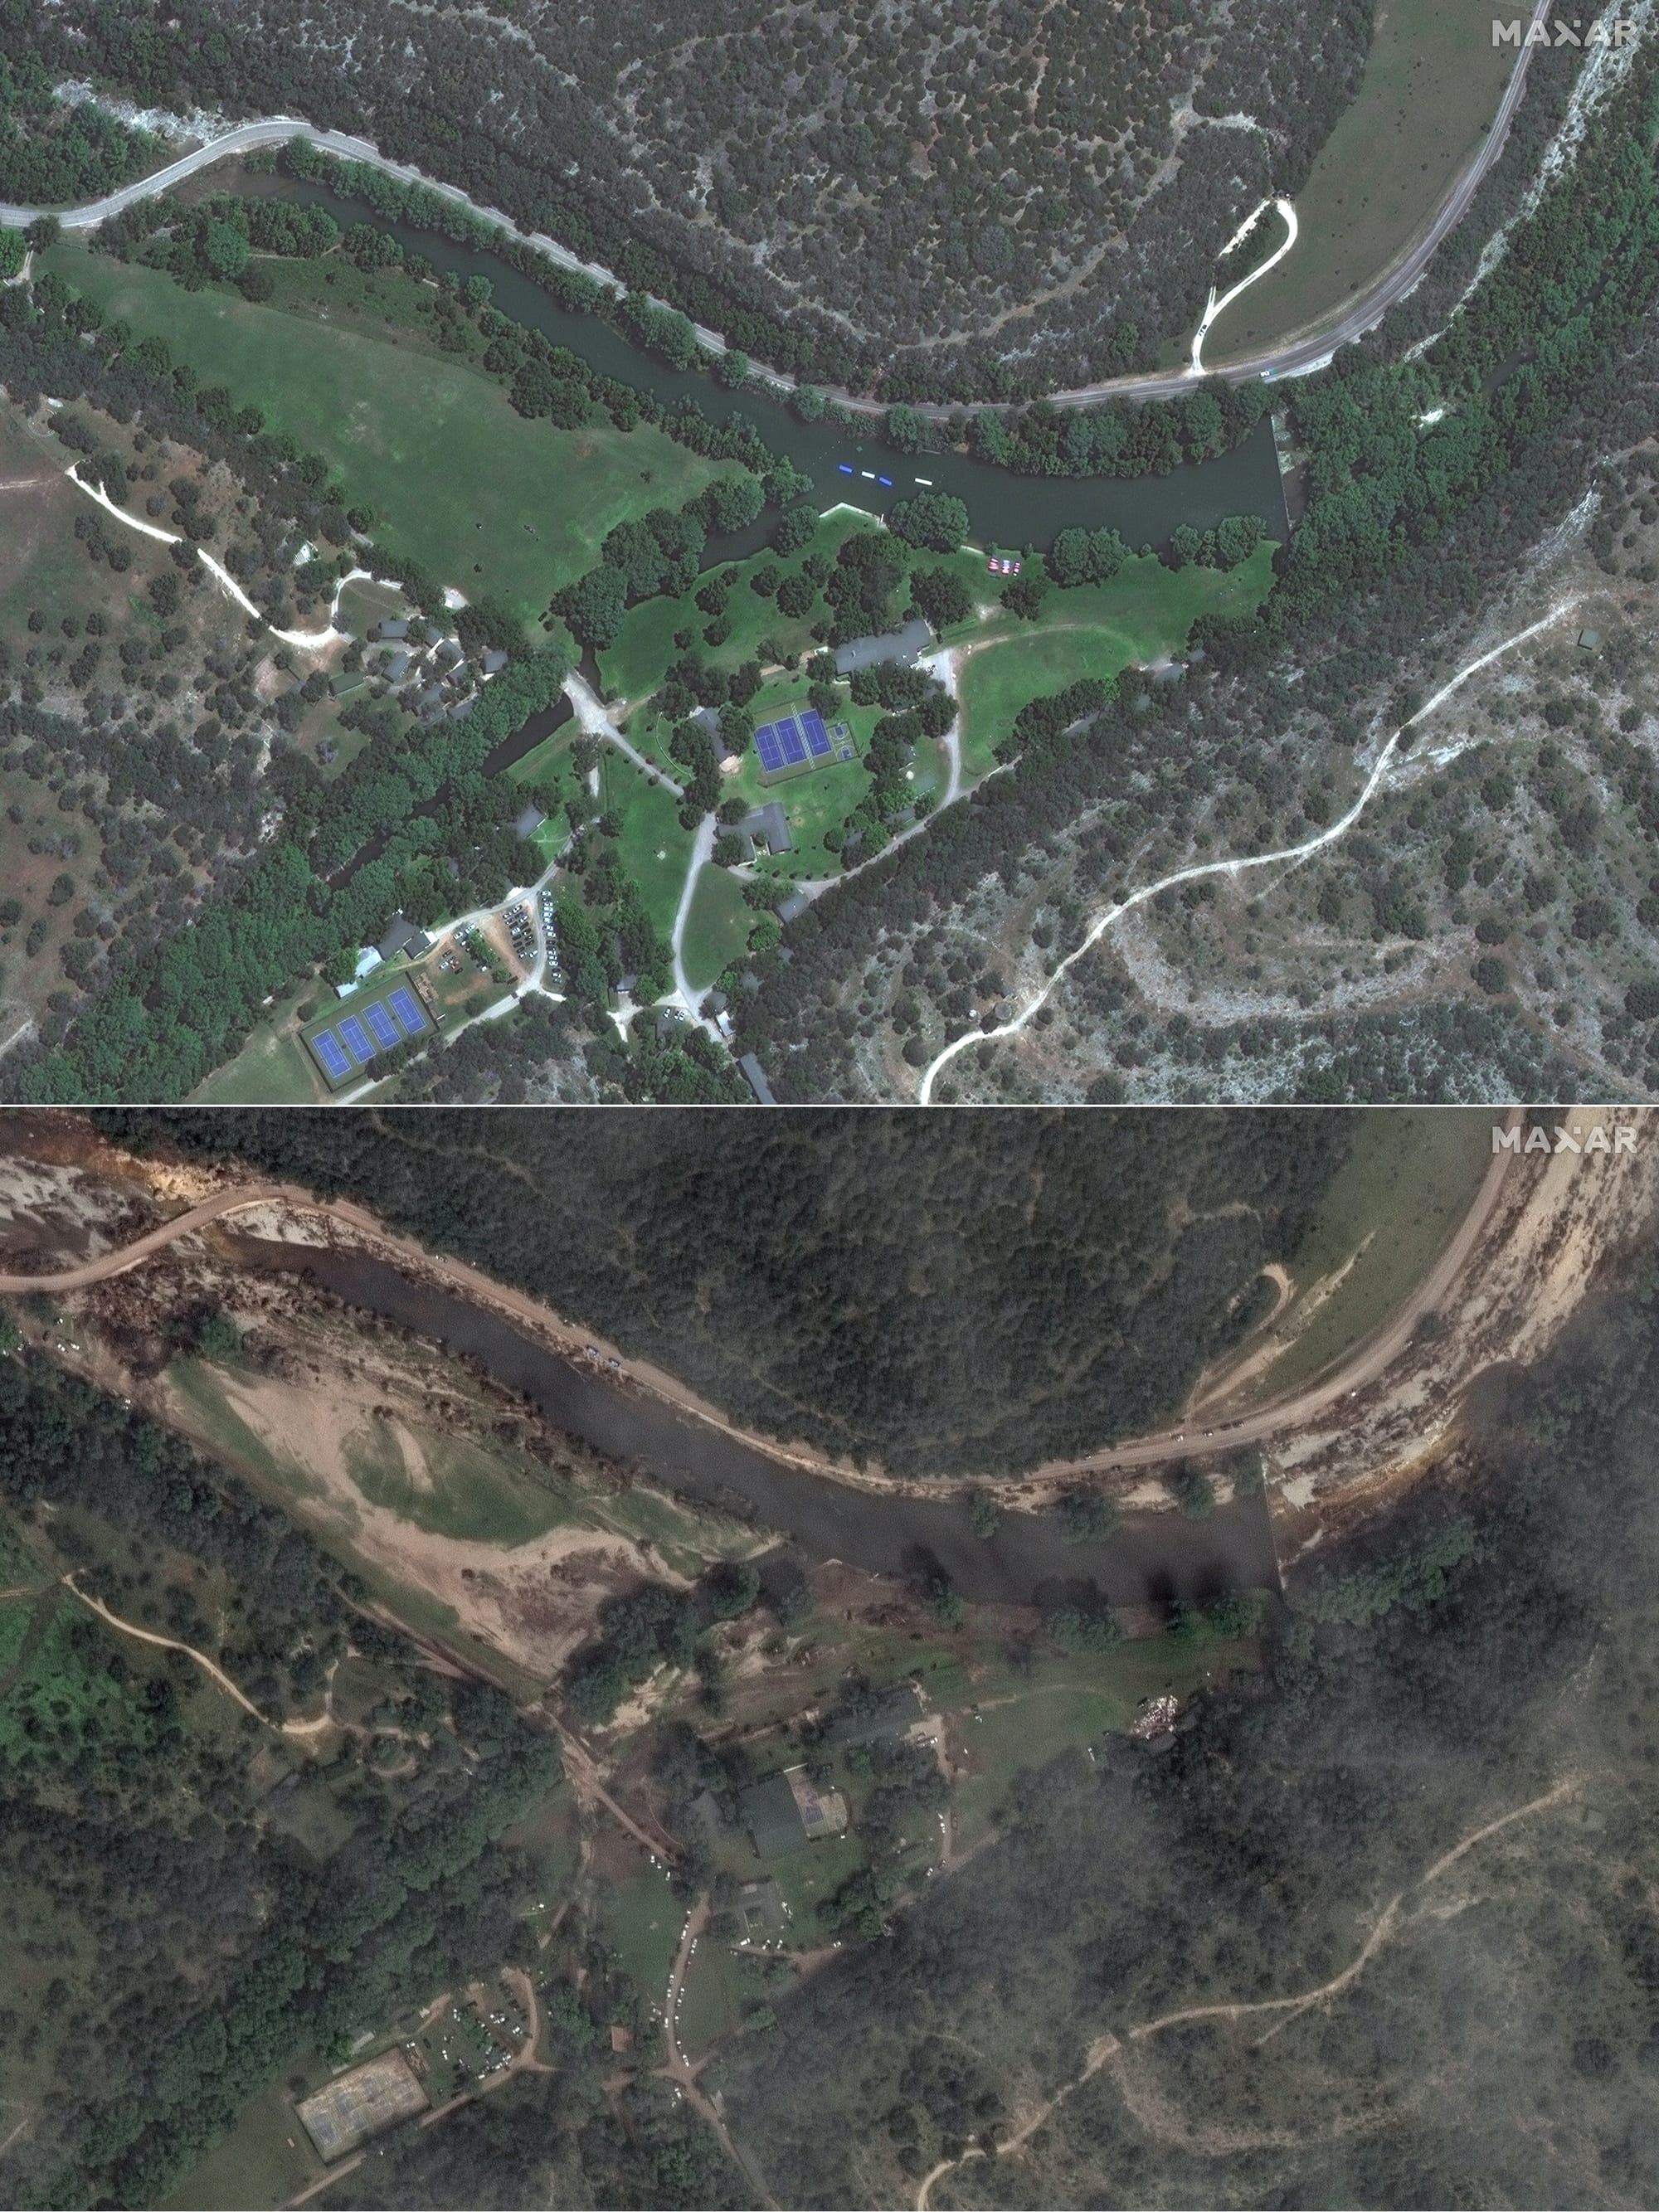
NASA UAVSAR flights provided detailed imagery of the flood’s impact, marking flooded roads, fields, and urban areas. Comparisons of before-and-after images showed significant inundation.
Of the 160 initially unaccounted for, 3 were still missing by July 12. Camp Mystic confirmed 27 fatalities among campers, including 15 children under 15.
FEMA Director Ken Pagurek resigned, citing bureaucratic problems, funding constraints, and delays in emergency contracts. The Texas Tribune and other outlets began to criticize FEMA’s rule changes from the pandemic era that limited funding approval to higher offices.
Climate & Environmental Forensics: How Warming Fueled Destruction
Global Warming and Increased Rainfall
Since 1970, Central Texas has warmed by about 1.2 °C, increasing average surface moisture by roughly 10–15%. This allowed a single weather system to produce 7% more rain than would have otherwise occurred.
NOAA’s Climate Attribution Service confirmed that the record rainfall in July 2025 was at least three times more likely due to climate change, with extreme rains rising across the nation.
Terrain, Hydrology, and Increased Runoff
The steep limestone hillsides in Hill Country push rainfall into narrow rivers, quickly filling small watersheds.
Soil tests after the event showed that soil saturation reached 95% in many areas—so additional rain turned into runoff rather than absorption.
Stalled Jet Stream Dynamics
Blocked weather patterns, a clear sign of climate disruption, led to persistent storms. Research suggests that a jet stream configuration trapped moisture and rain above Texas for four days straight.
Infrastructure Collapses: When Systems Fail
Stormwater Drains and Highway Design
- Engineers examined numerous storm drains on Highway 16 and County Road 244, discovering that 87% were clogged with sediment and debris within six days.
- Many drains, built before modern flash flood guidelines, could not handle flows exceeding 10 inches per hour.
- Paved roads created barriers that channeled water toward structures unable to withstand such pressure.
Dam, Levee, and Culvert Shortcomings
- The aging Comal Creek Culvert, designed for rainfall of 7 inches per hour, collapsed midway, sending trucks and debris downstream.
- Smaller levees and retention ponds filled within minutes.
- Funding for retrofitting was never secured; towns with populations over 2,500 in Comal and Kendall lacked federal strategies for hazard mitigation.
Camp Mystic’s High-Risk Relocation
- A FEMA map update after 2013 removed Camp Mystic cabins from flood-risk zones to save on premiums. Experts later emphasized that the cabins remained within a “hundred-year” flood range, with only a 1–2-foot elevation shift, which was not justified for safety.
Policy Failures & FEMA’s Role in the Fallout
Mapping Errors and Insurance Gaps
FEMA maps did not account for more than 20 years of development, climate change, and hydrological shifts.
Over 95% of flooded homes lacked coverage. None of the cabins at Camp Mystic had flood insurance.
Zoning, Building, and Governance Issues
Texas gives counties limited control over floodplain management. In Kerr County, building permits increased by 50% in areas that are now underwater, with only minimal pre-development review.
FEMA’s Community Rating System, which provides insurance discounts for hazard improvements, was overlooked by rural areas, citing budget issues.
Federal Response Issues
Reforms from the Trump administration required contract approvals from the Office of Management and Budget and FEMA headquarters, which delayed the deployment of rescue teams, helicopters, and imaging resources.
Director Pagurek mentioned that "political interference prevented FEMA from using its own data." His resignation drew criticism from both parties.
Voices from the Flood
Survivor Stories: Warnings Ignored
Rosalie Castro, a grandmother from Kerrville, said, “The dogs didn’t bark, the sirens didn’t sound. The Camp Mystic director left us in the dark, and then the river came.”
Emergency call logs showed response delays of over 45 minutes for 911 calls.
Camp Staff Heroism
Kimberly Jones, the camp director, explained, “We started gathering kids at 4:12, but we couldn’t start evacuating until the school buses came at 5:05. That 50 minutes... we lost valuable time.” Camp procedures required waiting for official orders, which is a clear illustration of bureaucratic delays during disasters.
Rural Challenges: Unequal Impacts
Lower-income and rural residents living in trailers and campers faced higher fatality rates. An analysis showed a direct link between poverty and delays in evacuation as well as an increased likelihood of death.
Community Heroes
Volunteers like José Menéndez, who launched his kayak at dawn, rescued 18 people. His story included broken radios and thick fog under bridges that turned natural paths into dangerous obstacles.
Response Analysis: Rescue, Shelter, Health
Search & Rescue Coordination
Over 400 rescues took place in the first 72 hours, carried out by sheriff teams, volunteers, drones, and state EMS units. They operated without maps, GPS, or reliable communication, with some resorting to guiding families with cell phone videos.
However, unmapped debris blocked routes, causing ambulance response delays of up to 2 hours in some remote areas.
Hospitals and Health Services
Kerrville Regional reported being at capacity by 09:30 a.m. on July 4, with 50% of beds occupied by flood survivors. Two infant respiratory units noted an increase in asthma-like illnesses due to mold and humidity.
Portable medical units were deployed in Ingram and Hunt within three days, supported by the Texas Department of State Health Services.
911 Dispatch Issues
Rural counties such as Bandera and Kendall didn’t have 24/7 dispatch staffing. This led to delays when residents called 911 during peak flood situations, with many unanswered calls.
Shelter, Medical Follow-Up, and Mold Risks
Thirteen emergency shelters opened across several counties, but rural needs were not fully met. Overcrowding led to sanitation issues and respiratory infections.
A 60-day emergency Medicaid expansion supported treatment; however, psychological care for survivors remained underfunded and largely reliant on volunteer efforts.
Recurring Patterns & Nationwide Comparison
| Flash Flood Event | Year | Deaths | Rainfall | Damage | Key Takeaway |
|---|---|---|---|---|---|
| Rapid City, SD | 1972 | 238 | ~15″ in hours | Catastrophic | Infrastructure unprepared for canyon runoff |
| Big Thompson Canyon, CO | 1976 | 144 | ~12″ in <12 hours | Deadly canyon flood | Warning systems nonexistent |
| Texas Hill Country, 2025 | 2025 | 135+ | 20–26″ in <48 hours | Severe infrastructure failure | Climate legacy & mapping failures intertwined |
Unlike Rapid City or Big Thompson, Texas has had decades of digital warning tools, regional climate data, and FEMA funding that should have prevented this disaster, yet failures stemmed from human systems rather than nature alone.
Environmental & Economic Consequences
Mold, Mental Health, and Health Impacts: Within three weeks, mold was found in 65% of inspected homes, and 2% of children under 12 reported asthma symptoms. Clinics offered free masks and breathing treatments.
Interviews revealed PTSD-like symptoms among survivors, including nightmares, anxiety when it rains, and trouble returning home.
Housing Loss and Economic Fallout: More than 13,800 homes were destroyed or badly damaged, and 5,000 were deemed uninhabitable. Many were long-term rental properties without any insurance coverage.
Defaults on small business loans increased by 36% in affected counties. Agricultural losses were estimated at $190 million for destroyed crops and displaced livestock.
Social and Economic Inequities: Insurance disparities were significant: suburban homes had a 14% insurance rate compared to just 1.8% for rural properties. The rebuilding process resembled that of Hurricane Katrina, with government and NGO support directed mainly to wealthier individuals.
Policy Wake-Up Call: What Must Change
Mapping and Insurance Improvements
- FEMA maps must be updated every two years to reflect climate changes; enforcement of private flood insurance at the state level is needed.
- Long-term buyout programs for high-risk homes should be adequately funded, though community support can be a challenge.
Zoning Reform & Sustainable Infrastructure
- Rural counties require stricter zoning regulations that prevent development without proper storm modeling. Sustainable practices, such as permeable roads and retention basins, should become the norm.
- Implementing upstream retention and drainage systems could help manage future flood conditions.
Emergency System Enhancements
- Annual testing of IPAWS should be mandatory; local leadership must have the authority to issue evacuation orders without additional permits.
- Establishing a permanent search-and-rescue team in Hill Country, equipped with dedicated helicopters, radios, and gravel road protocols, is essential.
FEMA Reform & Regulatory Simplification
- Reinstating FEMA’s power to deploy without barriers is crucial, as is removing bureaucratic constraints that delay contracts.
- Restoring local hazard mitigation funding using pandemic relief funds should match contributions from the state to build rural resilience.
Rethinking the Takeaway
The Texas flood of July 2025 is not just a single tragedy; it serves as a warning about gaps in the nation’s climate readiness. Meteorology provided the data, geography made the flooding inevitable, and infrastructure failures, along with policy shortcomings, caused the loss of life. In an area known as "Flash Flood Alley," we built communities without considering flood risks, overlooked outdated maps, and ignored warnings. As climate science predicts more extreme conditions, our systems must improve, or we will face more tragedies.
Today’s flash floods are tomorrow’s dry streams. Climate change has permanently shifted flood lines, making once-rare events more common. The true test of policy is not about controlling the weather; it’s about being prepared for the inevitable outcomes of climate change.
In practical terms: rebuild with water management in mind, give timely warnings, and never underestimate how quickly a hill country creek can become a deadly force. The next storm surge will not be a matter of luck; it will test what we've learned from this event.
Closing Thought: Baseline of Catastrophe
How can Texas and the nation reshape hazard systems to balance growth and resilience? Should flood risk be a factor in lending decisions? Is it feasible for rural counties to implement sustainable infrastructure? Share examples of communities successfully enacting flood-smart development and how those lessons can guide future changes.
Sources
- Timeline & Warning Analysis: NWS advisories, GL Drought Center, Wikipedia (en.wikipedia.org)
- Climate Attribution Models: NOAA, IPCC, ClimaMeter, peer-reviewed assessments
- Infrastructure Investigations: Texas Tribune, Phys.org, US Geological Survey soil hydrology
- Emergency Response Data: Houston Chronicle, AP News, Washington Post
- Insurance & FEMA Mapping Reports: Houston Chronicle, Texas Tribune, Politico, FEMA policy briefs
- Satellite Imagery: NASA Applied Sciences UAVSAR missions, GOES-19 Infrared, Maxar Technologies via Reuters
- NASA / IMERG via GPM mission
- U.S. Geological Survey (USGS)
- Medical & Health Data: Texas Department of State Health Services, local hospital intake logs
- First-Person Interviews: Survivor accounts via Washington Post, Guardian, TV transcripts